
A 3 MW solar farm has roughly 12,000 panels. Some of them are broken. The question is: which ones?
The traditional answer involves a certified thermographer, a handheld thermal camera, a lot of walking, and approximately 200 hours of someone’s life they are never getting back. For a single farm. We thought there had to be a better way.
There is. It involves a drone, an infrared camera, and two AI models that we pit against each other to see who could spot a sick solar panel faster.
The problem with solar panels is that they fail quietly
A broken window is obvious. A defective solar panel just… silently produces less electricity.
It could be a hot spot — a shadow from a bird dropping, a smear of soiling, or physical damage that concentrates heat in one cell and can slash a module’s output by up to 90%. It could be a bypassed string caused by a lightning strike that fused a diode into permanent conduction, burning through 33–66% of a module’s production. Or it could be something with the wonderful name of Potential Induced Degradation, which sounds like a 1970s psych band but is actually an early-stage electrical failure that quietly eats your yield before you even know it’s there.
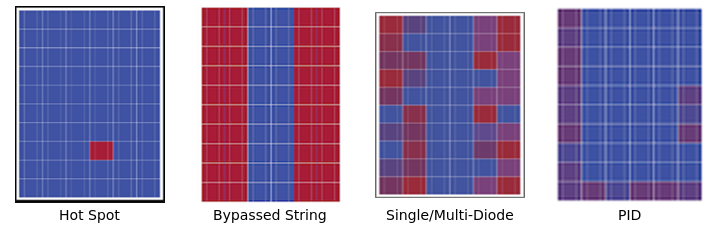
Each of these defects has a thermal signature. Under an infrared camera, a hot spot glows like a tiny angry sun in one corner of the panel. A bypassed string shows as a cold dark stripe. Knowing the difference matters enormously — both for deciding how urgently to act and for understanding what went wrong in the first place.
The catch: you need to look at every single panel to find the ones with problems. And on a commercial installation, that’s a lot of panels.
But I have a warranty you say? A typical commercial PV module comes indeed with a 25-year performance guarantee, which sounds reassuring until you ask the obvious follow-on: guarantee relative to what? To claim on an underperforming panel, you need to know it is underperforming, which means you need to have checked it, which means you need to have paid for an inspection first. A warranty is only as useful as your ability to invoke it — and invoking it starts with knowing which panels to point at.
Enter the drone
Our study was conducted at a solar park in Wilhelmshaven, Germany. 55,000 square meters, 11,914 panels, commissioned by Volksbank Wilhelmshaven in 2013. A real installation with real age-related issues — not a shiny lab environment designed to make results look good.
Our tool: a DJI Mavic 3T, equipped with a radiometric thermal camera.
“Radiometric” is the key word here. A regular thermal camera gives you a color-mapped picture of heat, which is pretty but not particularly useful for automated analysis. A radiometric camera records the actual temperature for each individual pixel. That’s the difference between a portrait of a thermometer and a thermometer.
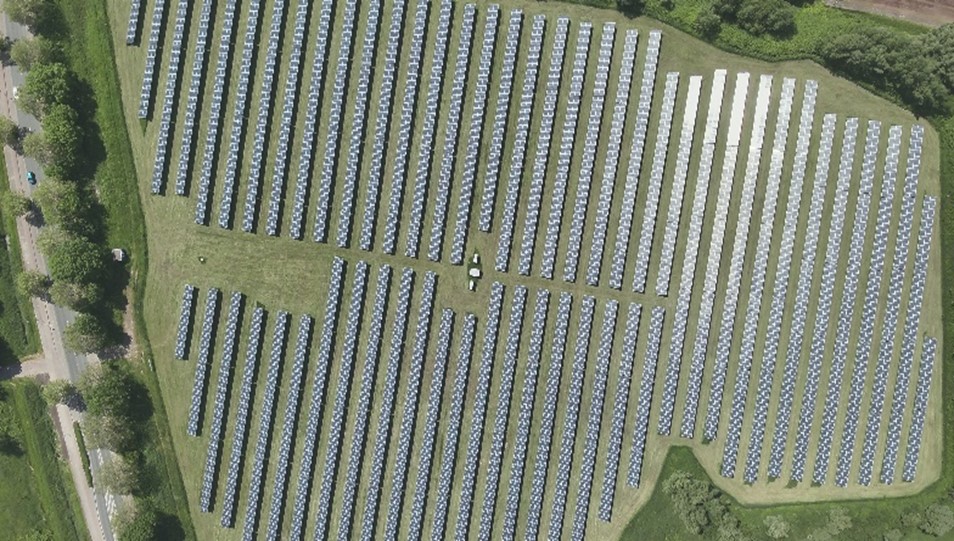
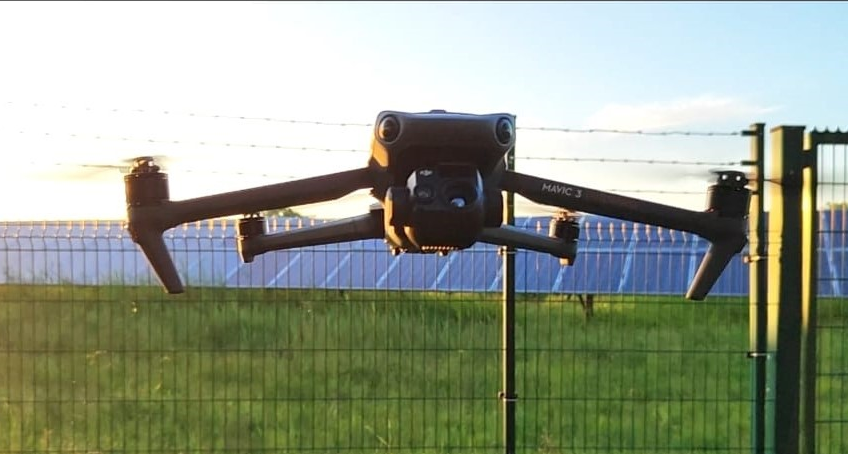
In 70 minutes of automated flight, the drone captured 2,028 thermal images covering the entire site. A manual ground inspection of the same area would take days.
This alone, before any AI gets involved, is already a meaningful result.
From pixels to fault reports: the three-stage pipeline
Raw drone footage is not a maintenance report. It takes a pipeline to turn 2,028 photos into a list of which panels need attention and why.
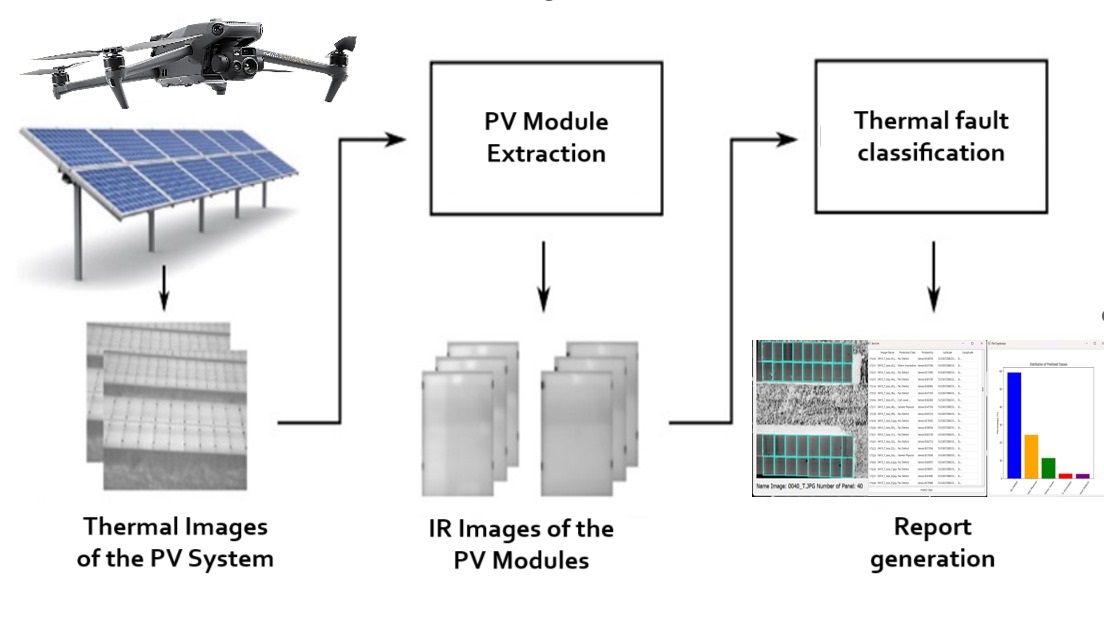
Stage 1: Find every panel.
A TensorFlow segmentation model, trained on manually annotated images, locates and extracts individual PV modules from each thermal frame. This is harder than it sounds. Drone photos have lens distortion, perspective overlap, and variable lighting. We corrected for barrel distortion first using OpenCV, calibrated specifically for the Mavic 3T camera. Then the segmentation model went to work.
The result: 96.8% precision, 100% recall, 98.4% F1-score.
Quick definitions: precision is how often a positive prediction is actually correct; recall is how many of the real positives you actually caught. F1-score is the harmonic mean of the two — a single number that penalises you equally for being sloppy or for missing things. A perfect score is 100%.
100% recall means it found every single panel in the dataset. Not one missed. That matters — a missed panel is a defect you never check.
Stage 2: Classify the defect.
Once you have 12,000 individual cropped panel images, you need to decide what’s wrong with each one. We built a custom dataset of 1,545 labeled single-module thermal images across five categories: severe physical damage, cell-level defects, minor anomalies, systemic issues, and no defect. Roughly 300 images per class, manually curated.
Two classification models were then trained on this dataset and compared: YOLOv8 and Vision Transformers. More on them in a moment.
Stage 3: Report.
A graphical user interface presents the findings to the operator. No reading thousands of raw images. No spreadsheets. Just: here is what we found, here is where it is, here is how bad it is.
The model fight: YOLOv8 vs. Vision Transformers
This is the part I found most interesting to work on.
YOLOv8 — “You Only Look Once” version 8 — is a family of fast, practical computer vision models. We used the medium-sized classification variant, YOLOv8m-cls. It’s well-known, computationally efficient, and battle-tested in real-world detection tasks. The workhorse of the field.
Vision Transformers (ViTs) are a more architecturally unusual choice. They originate in natural language processing — the same family of attention-based architectures that powers modern large language models. A ViT doesn’t process an image as a whole. Instead, it slices the image into small patches (16×16 pixels in our case) and processes them as a sequence, the way a language model processes words. This lets the model reason about relationships between different parts of the image rather than just local features.
The analogy: YOLOv8 glances at a panel and makes a fast, confident call. ViT reads it the way a careful radiologist reads an X-ray — patch by patch, weighing context.
Both were trained exclusively on our custom dataset, on a Tesla T4 GPU in Google Colab. No external data, no pre-existing thermal datasets. Everything curated from scratch.
The results
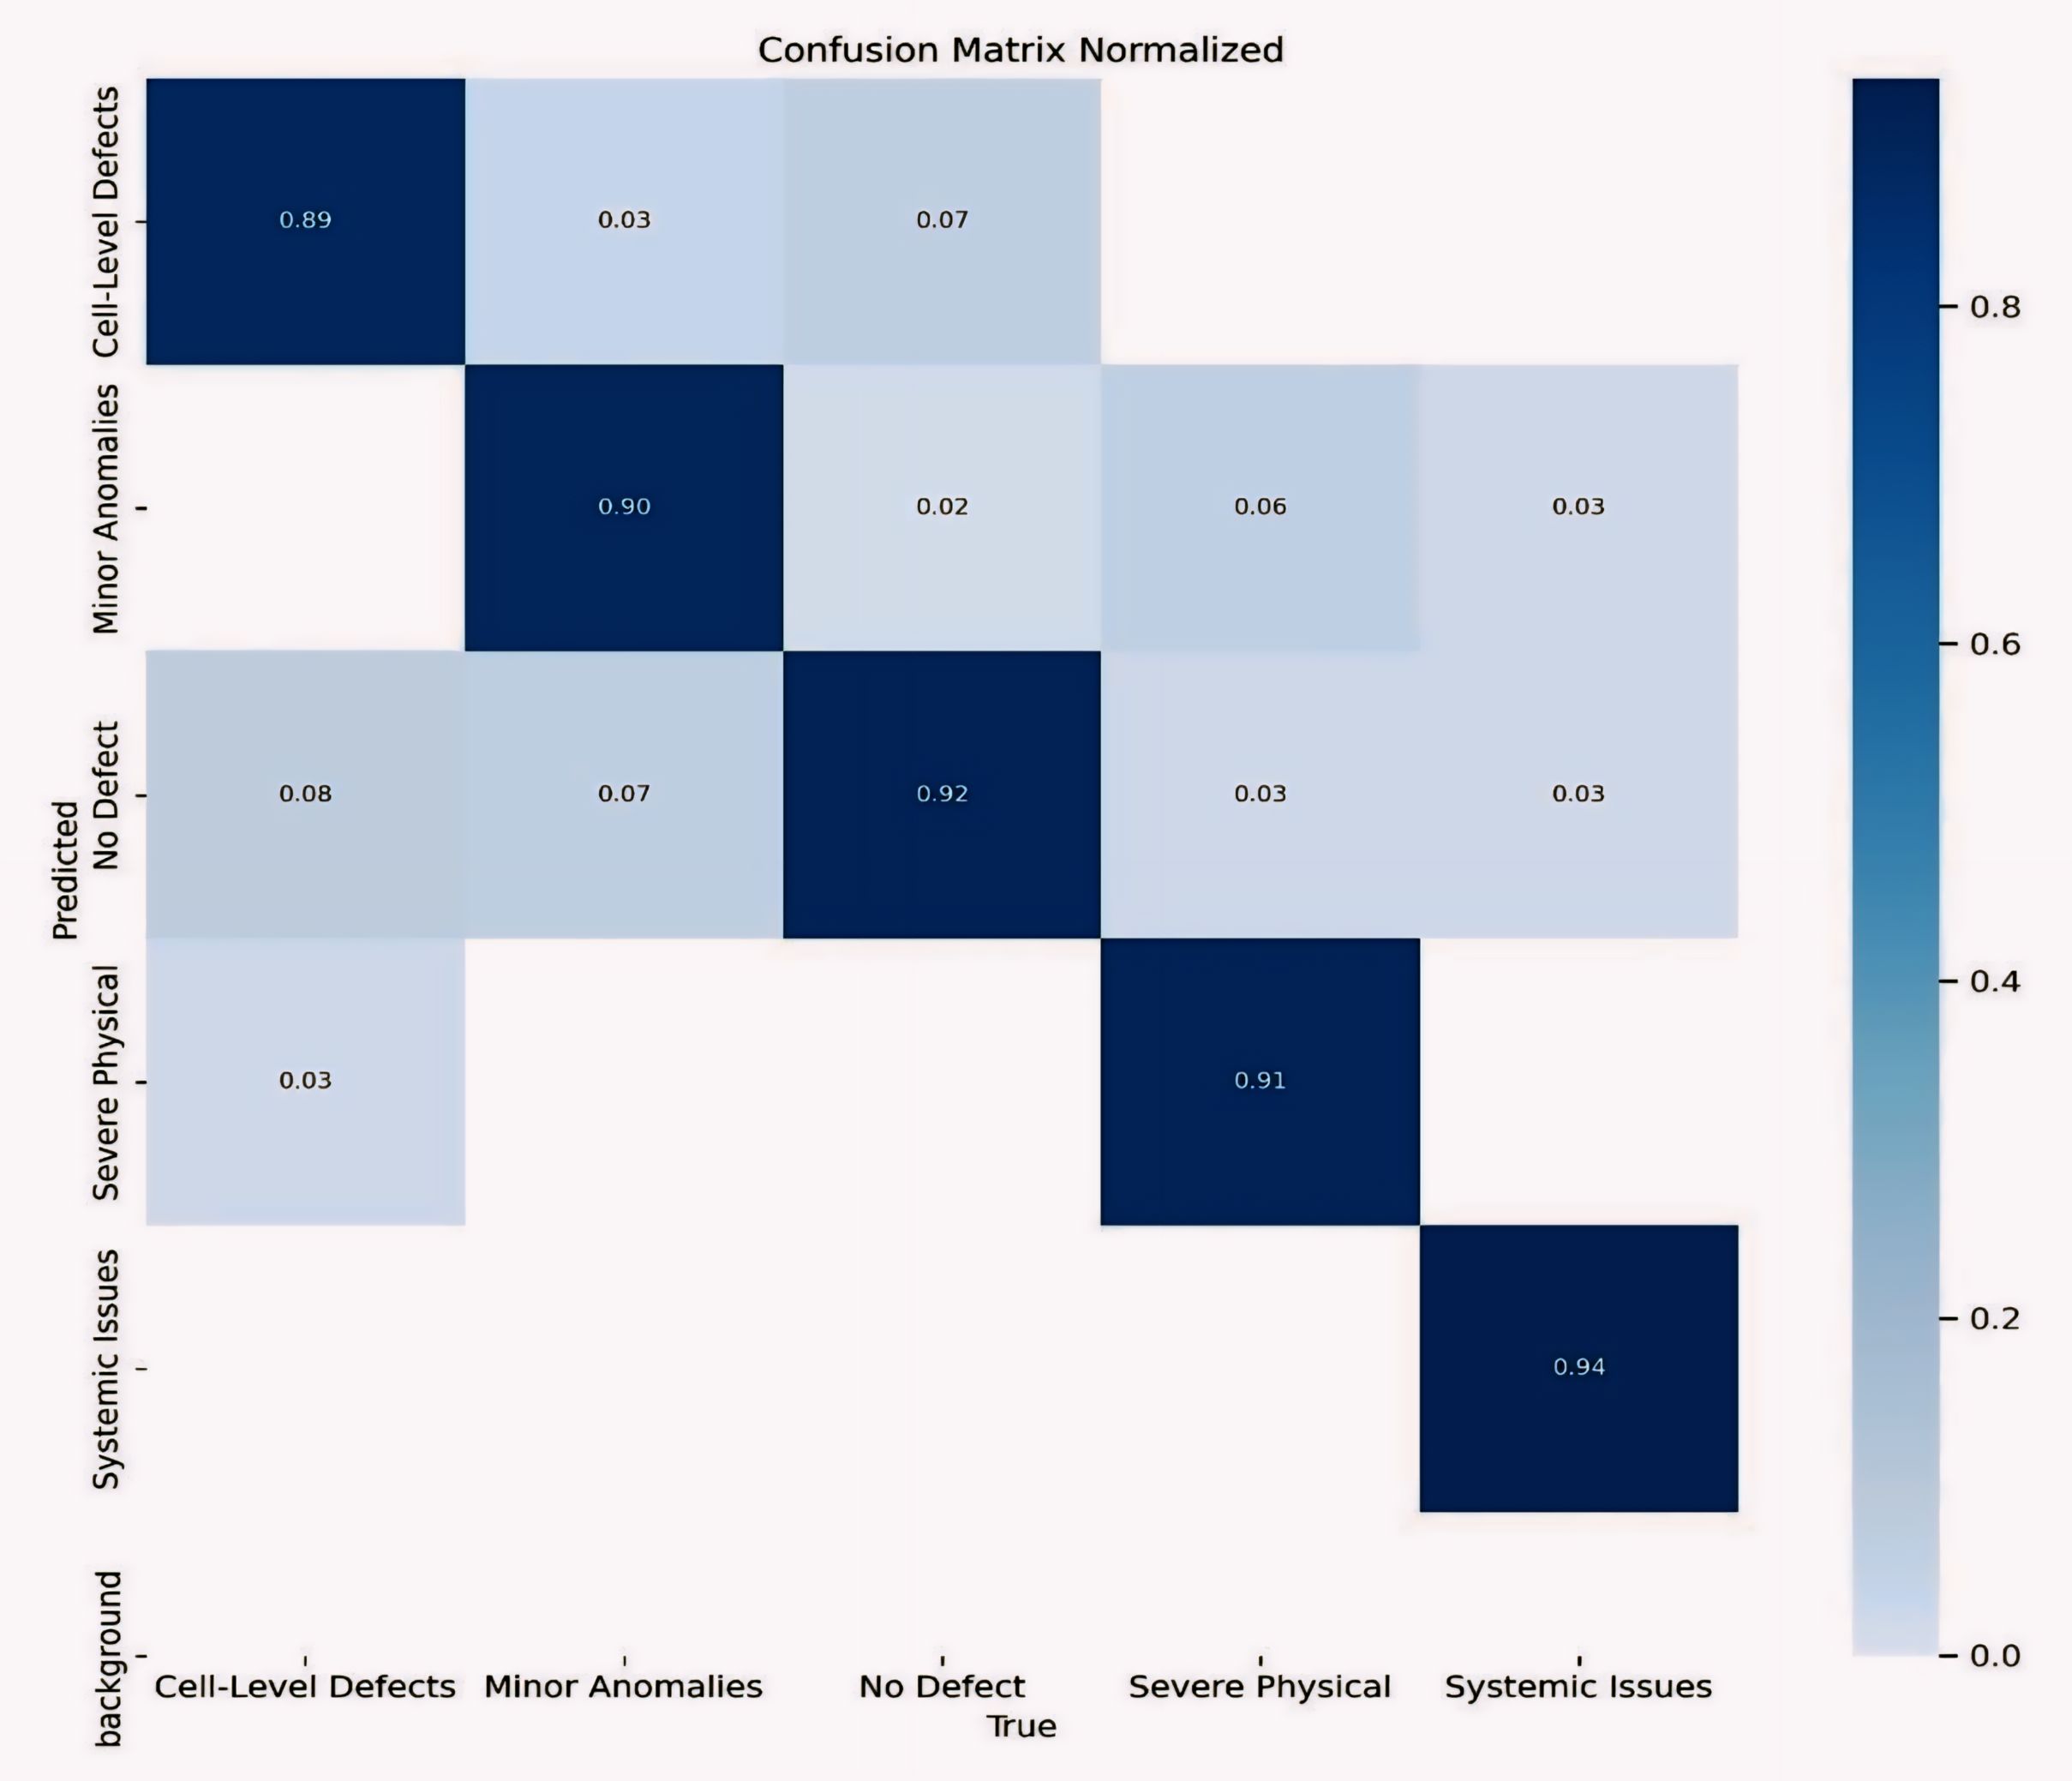
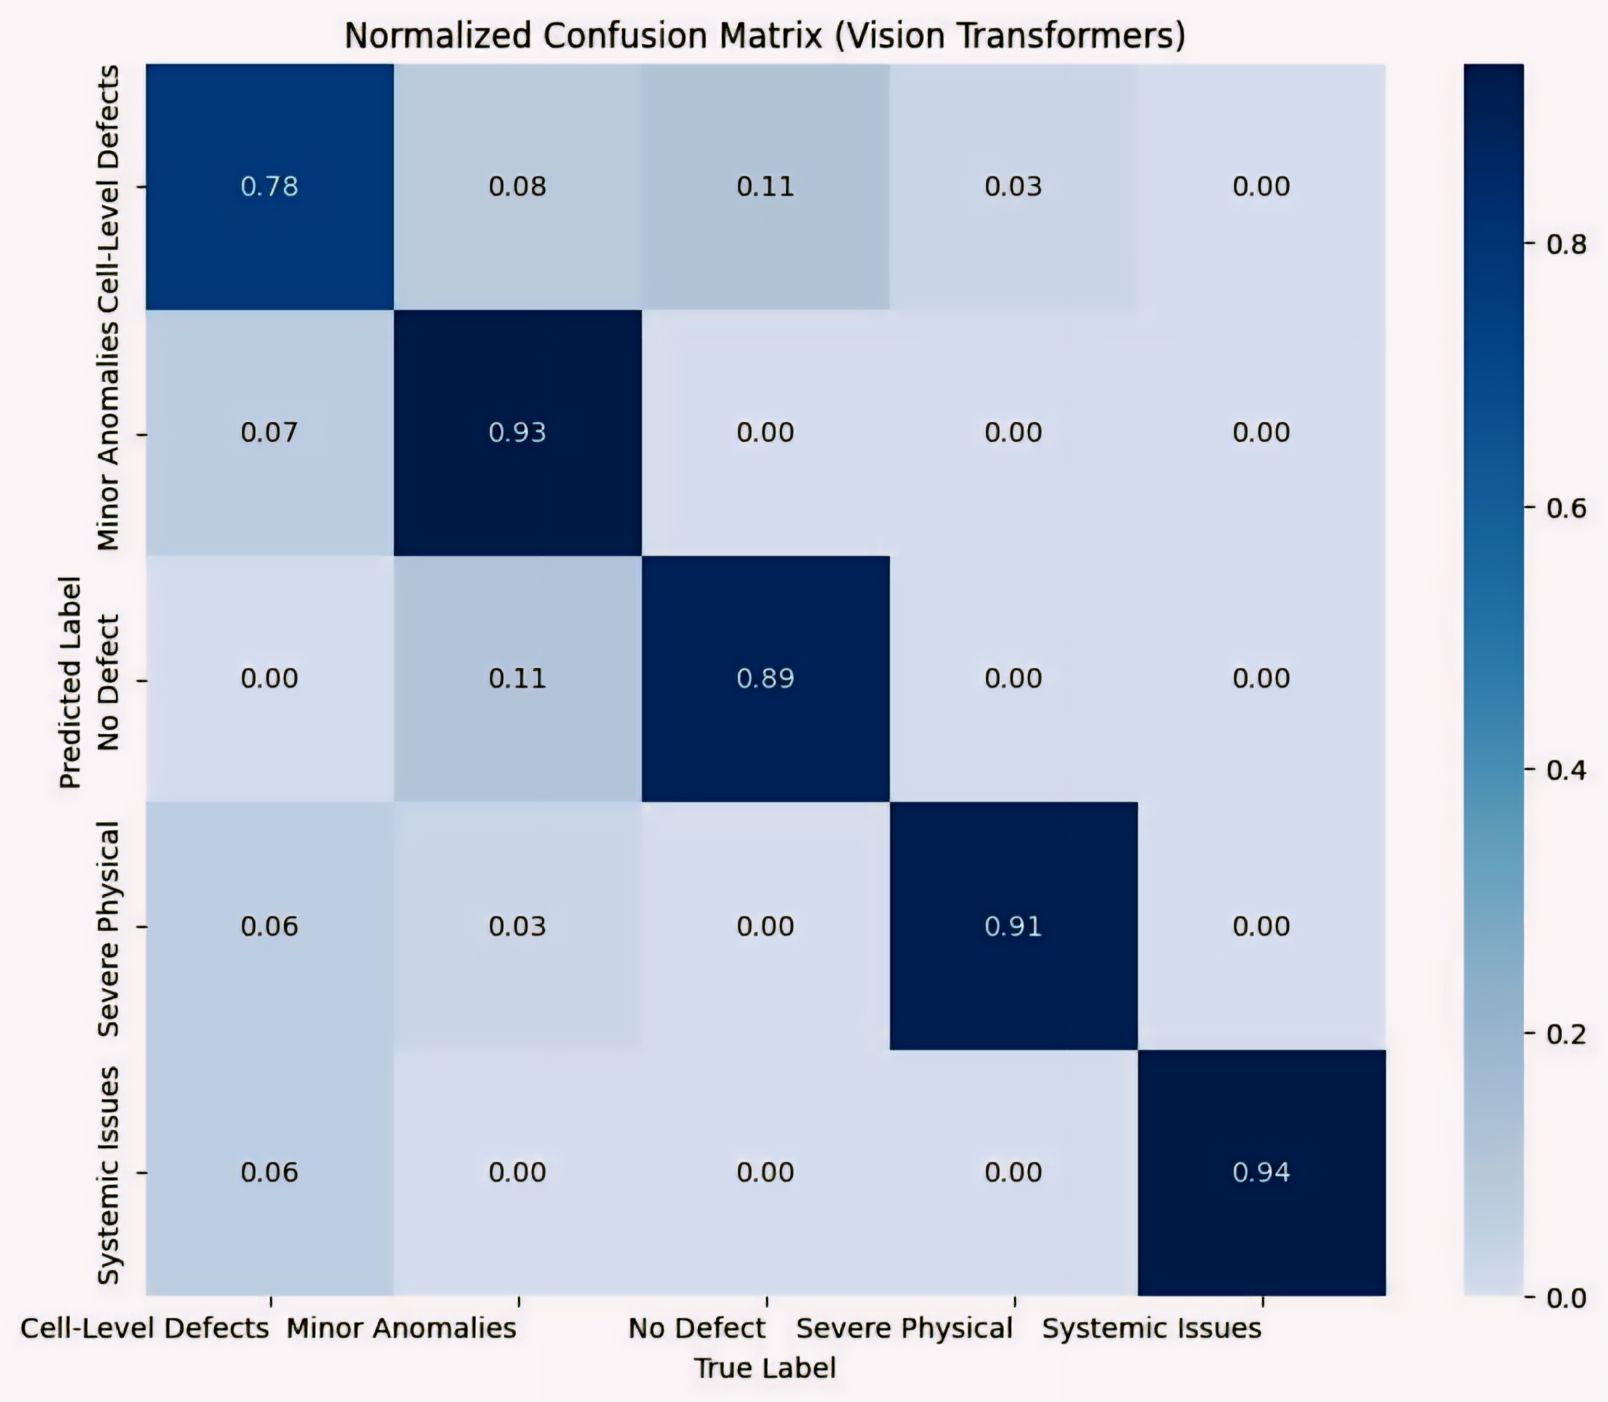
YOLOv8 results:
Defect Type | Precision | Recall | F1-score |
|---|---|---|---|
Cell-Level Defects | 86.4% | 89.9% | 88.1% |
Minor Anomalies | 90.0% | 91.8% | 90.9% |
No Defect | 89.5% | 87.0% | 88.3% |
Severe Physical Damage | 93.8% | 93.8% | 93.8% |
Systemic Issues | 100.0% | 96.9% | 98.4% |
Vision Transformer results:
Defect Type | Precision | Recall | F1-score |
|---|---|---|---|
Cell-Level Defects | 88.0% | 85.0% | 87.0% |
Minor Anomalies | 89.0% | 87.0% | 88.0% |
No Defect | 91.0% | 93.0% | 92.0% |
Severe Physical Damage | 92.0% | 90.0% | 91.0% |
Systemic Issues | 93.0% | 92.0% | 92.0% |
YOLOv8 peaks higher — especially on systemic issues, where it hits a remarkable 98.4% F1. ViTs are more consistent: no category dips below 87%, and it handles the “no defect” class better, which matters if you want to avoid false alarms.
Both beat the previous published benchmark of 86% F1 from AlexNet-based approaches on comparable tasks.
So who won?
Honestly, neither. Or both, depending on what you actually need.
If you’re running this in the field on a laptop with limited compute, YOLOv8 is the practical choice. Lower resource requirements, fast inference, excellent peak performance.
If you’re building a platform where consistent accuracy across all defect types is paramount — where a miss on a subtle cell-level defect is as costly as a miss on a severe one — ViTs have the edge in reliability.
The area where both models struggle is cell-level defects. At 64×96 pixels, the thermal signature of a minor cell crack looks frustratingly similar to a healthy panel. This is not really a modelling failure; it’s a resolution limitation. A natural next step is combining both models, or adding the drone’s RGB imagery alongside the thermal data.
Why any of this matters
Solar capacity is growing fast. The IEA projected 305 GW of new renewable installations per year between 2021 and 2026 — a 60% increase over the previous cycle. Most of that is photovoltaic. And most of it will quietly degrade unless someone checks.
The checking, until recently, meant walking.
The infrastructure to do this automatically now exists. A drone, a thermal camera, and the right pipeline can cover a 3 MW installation in 70 minutes and deliver a panel-by-panel fault report — the kind you can actually hand to a maintenance team or attach to a warranty claim. If you operate a solar asset and want to know what this looks like in practice, we would be glad to talk.
The inspectors aren’t going away. But maybe they can stop spending 200 hours crossing a field with a handheld camera, and start spending that time actually fixing things.
The paper was published as part of work at Jade University of Applied Sciences, Wilhelmshaven.