

Somewhere on a wind farm right now, a technician is clipped to a rope, dangling next to an 80-meter blade, trying to decide whether a hairline mark in the gelcoat is a problem or just weather. It is one of the more dangerous jobs in renewable energy, it does not scale, and, because “is this bad” is ultimately a judgment call, two inspectors looking at the same mark can disagree.
We ran an experiment to see whether that judgment call could be handed to a machine instead: four different deep learning architectures, trained on drone photos of real wind turbines, all racing to find and precisely outline blade damage. Two of the contenders were old and trusted. Two were borrowed from the world of language models and had never been tried on this problem before.
Drones already replaced the rope for the flying part of inspection. Fly around the turbine, take pictures, look at a screen instead of dangling from a harness. That’s real progress. But it just relocates the bottleneck: now somebody has to look at every photo of every blade, and they’re still eyeballing it.
What we wanted to know was whether a model could do more than flag “this blade looks damaged.”
We wanted it to trace the actual shape of the damage, a tight polygon around a crack rather than a rough box, and definitely more than a caption. That distinction matters in practice: a repair crew dispatched with “damage somewhere on blade 2” is a lot less useful than one dispatched with a precise outline of where to start.
To get there, we used a DJI Mavic 3T to fly three turbines from different manufacturers on a single autumn morning, full coverage of tower, nacelle, and blades from every angle, 56 minutes and 30 seconds of footage. After throwing out the redundant frames, we were left with 207 usable images, 72 of them showing actual damage: lightning strikes, leading-edge erosion, gelcoat cracks, surface damage, peeling paint. Every one of those was hand-traced with polygons, not boxes, and converted to COCO format so the models could be scored properly.
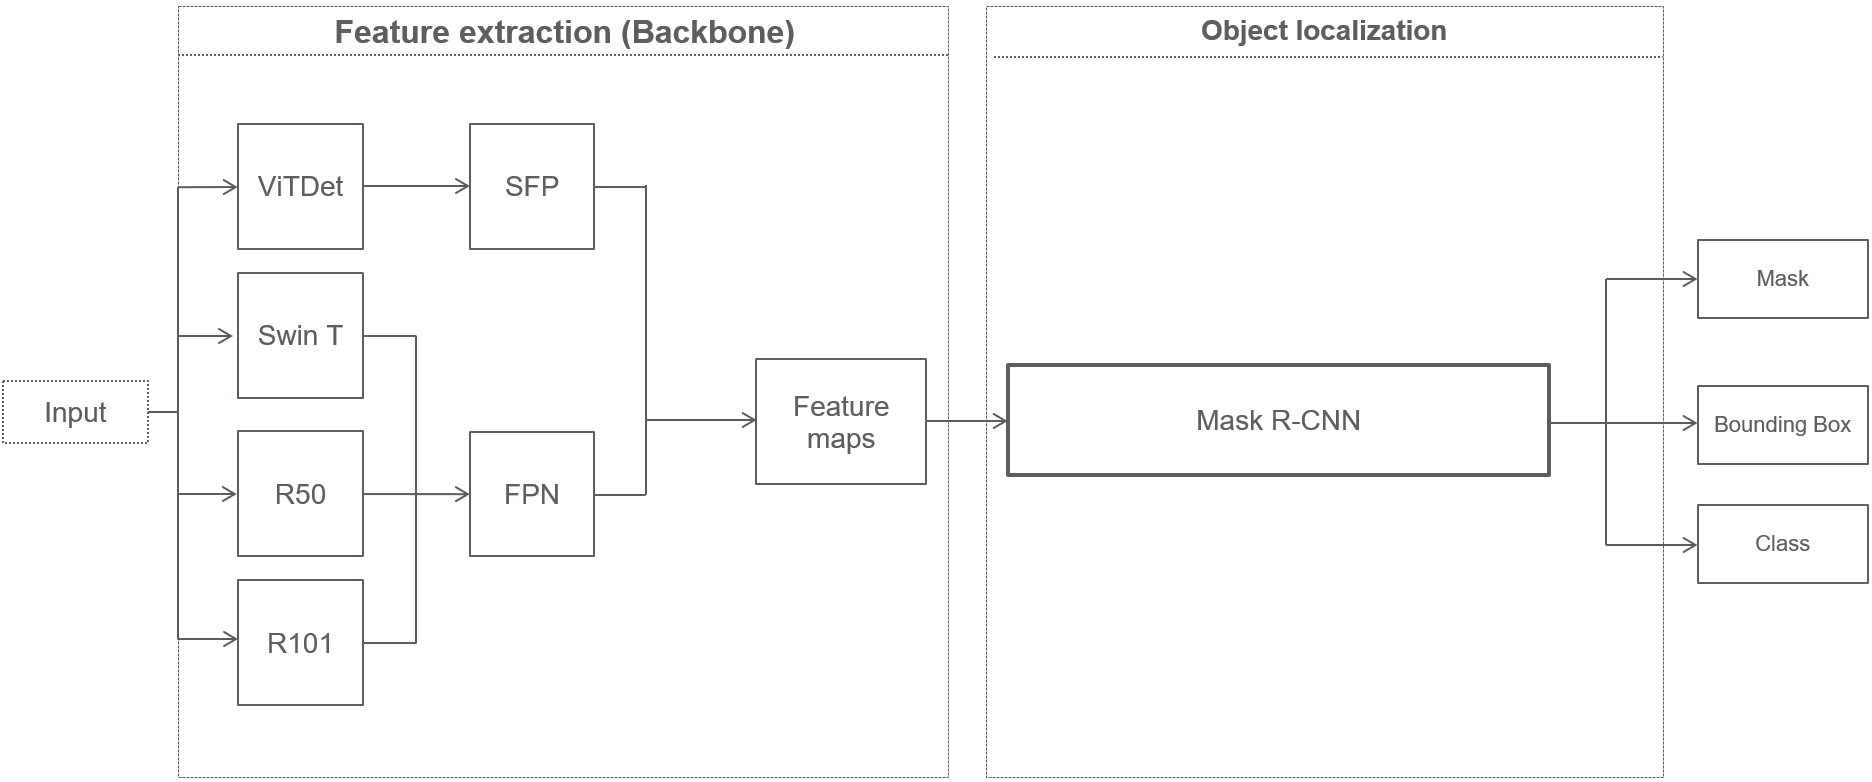
Feature extraction and object localization pipeline: four candidate backbones feed a shared Mask R-CNN head
Two old hands, two newcomers
ResNet50 and ResNet101 are the incumbents, convolutional networks that build understanding of an image through stacked local filters, each layer seeing a slightly bigger patch than the last. They’re fast, well understood, and have been the default choice for this kind of work for the better part of a decade.
ViTDet and Swin Transformer are the newcomers, and they borrow their core trick from language models: attention. The same mechanism that lets a language model decide which earlier words matter to the next one gets applied here to patches of an image instead of words in a sentence. ViTDet mostly lets any patch attend to any other patch, wherever it sits in the frame.
Swin Transformer is more disciplined about it, attention first computed inside small local windows, then those windows shift in the next layer so information can leak across the boundaries, one stage at a time.
The practical difference: a convolution is blind to anything outside its local filter. A transformer can, in principle, connect a two-centimeter discoloration to something happening ten centimeters away at the edge of the blade, context a small filter alone would never see. Whether that theoretical advantage actually shows up in the numbers was the whole point of running the comparison.
All four were slotted into the same Mask R-CNN detection framework, so nothing except the backbone itself differed between runs.
The scoreboard
We trained every architecture three times, on the original 207 images and on 4× and 8× augmented versions, to see how each one behaved as training data grew.
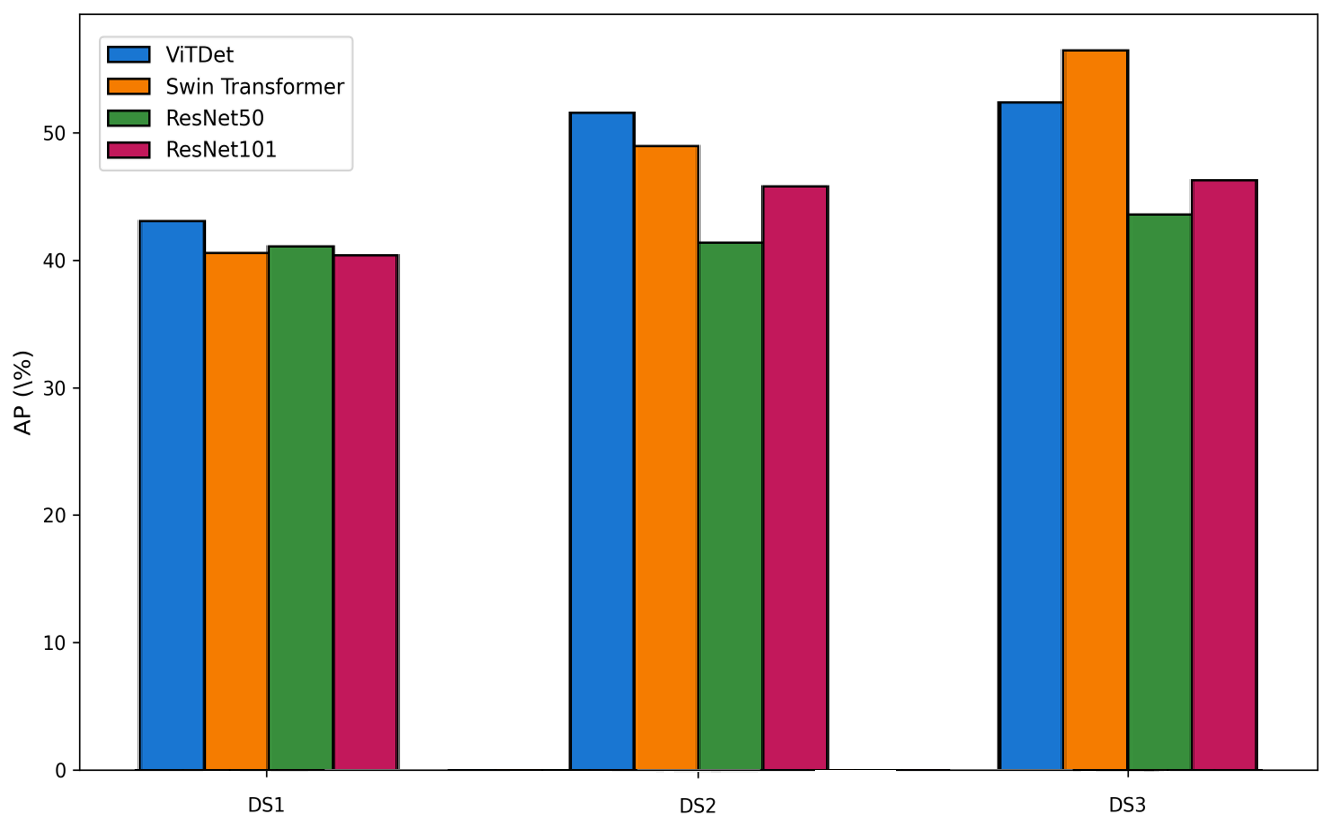
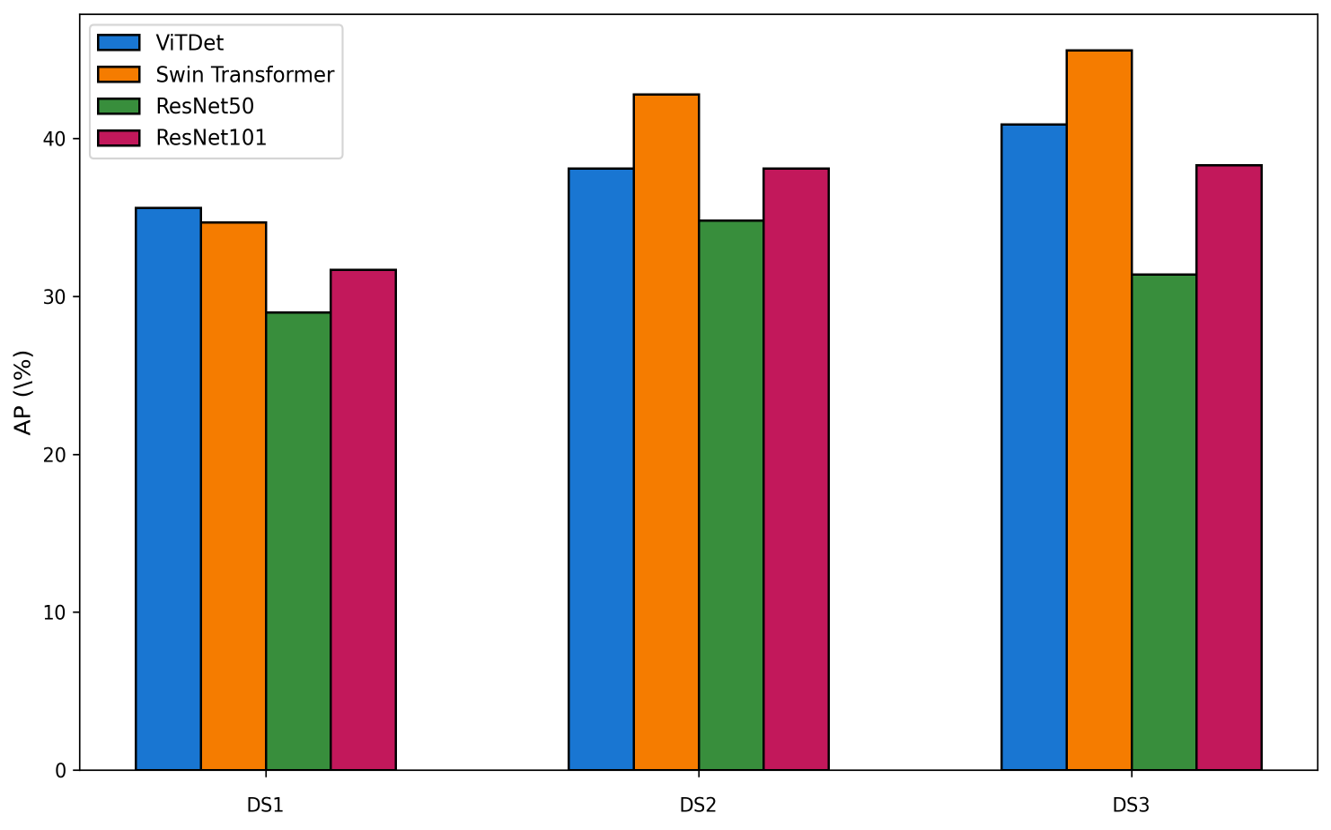
At the largest dataset size, the gap was not subtle:
Model | Bounding Box AP | Segmentation Mask AP |
|---|---|---|
ResNet50 | 43.6% | 31.4% |
ResNet101 | 46.3% | 38.3% |
ViTDet | 52.4% | 40.9% |
Swin Transformer | 56.5% | 45.6% |
But are they looking at the right thing?
A model can hit the right answer for the wrong reason, so we generated class activation maps: heatmaps of which pixels each model actually leaned on for the same patch of leading-edge erosion, across all three top architectures.
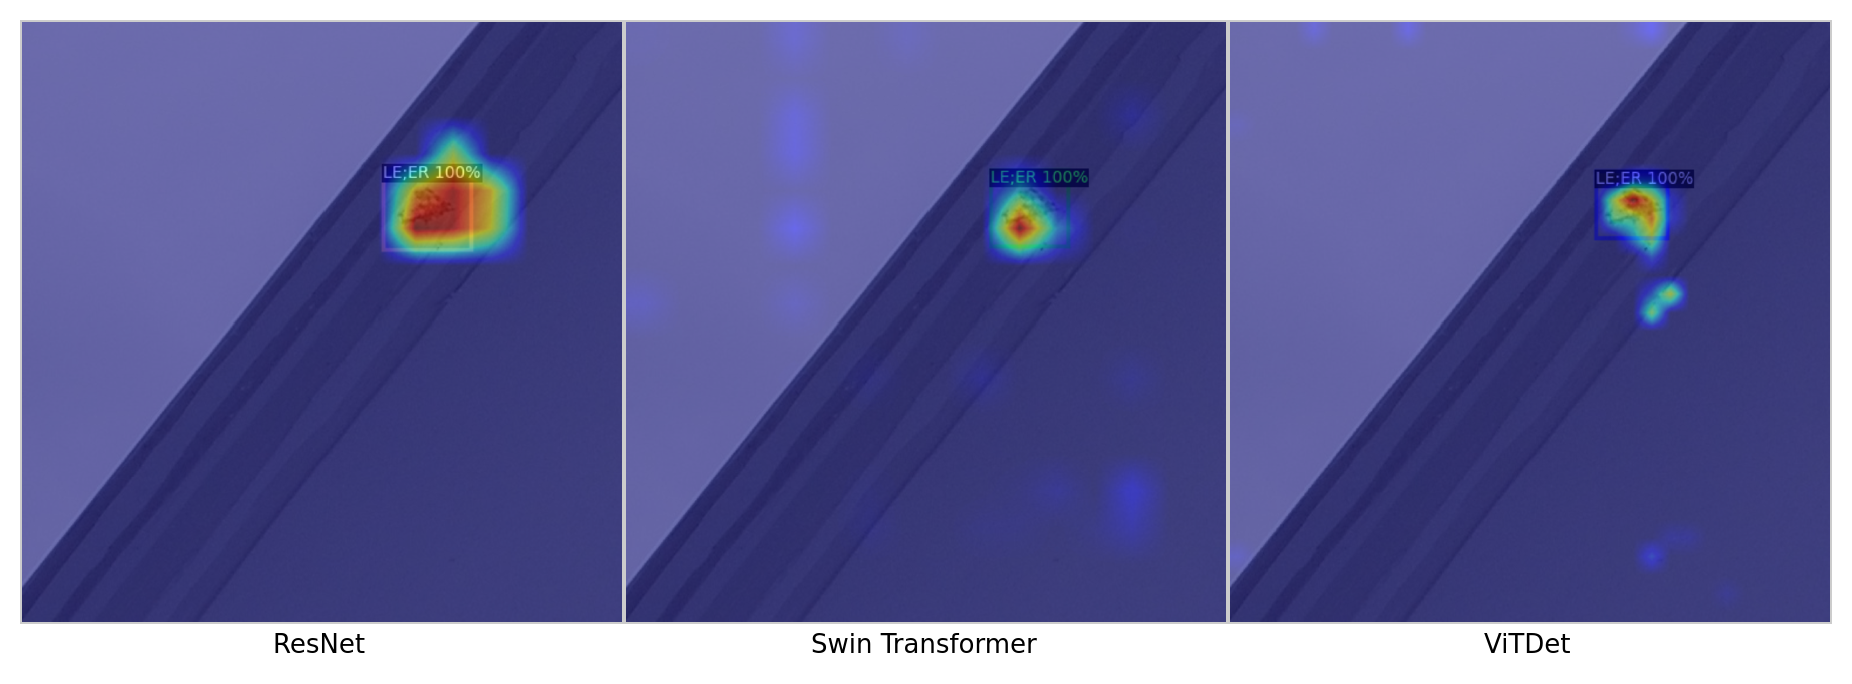
ResNet’s heatmap spreads into a broad, fuzzy red blob that bleeds well past the actual erosion. Swin Transformer and ViTDet both pull that focus in tight, ViTDet in particular traces the ragged real outline of the damage rather than a rough rectangle around it. The accuracy numbers and the heatmaps agree: the transformer models aren’t winning on a technicality, they’re genuinely looking at the right pixels.
The catch: none of these blades was spinning
Every image in the study came from stationary turbines. Real ones aren’t! A blade tip on a commercial turbine can move at over 300 km/h, and a moving blade photographed at normal shutter speed comes out smeared. A detection system that only works on parked blades only ever inspects turbines that were switched off for the day, which undercuts a good chunk of the economic case for doing this by drone at all.
We couldn’t safely fly next to a spinning blade for this study, so we simulated the blur synthetically instead and measured how much each architecture lost.
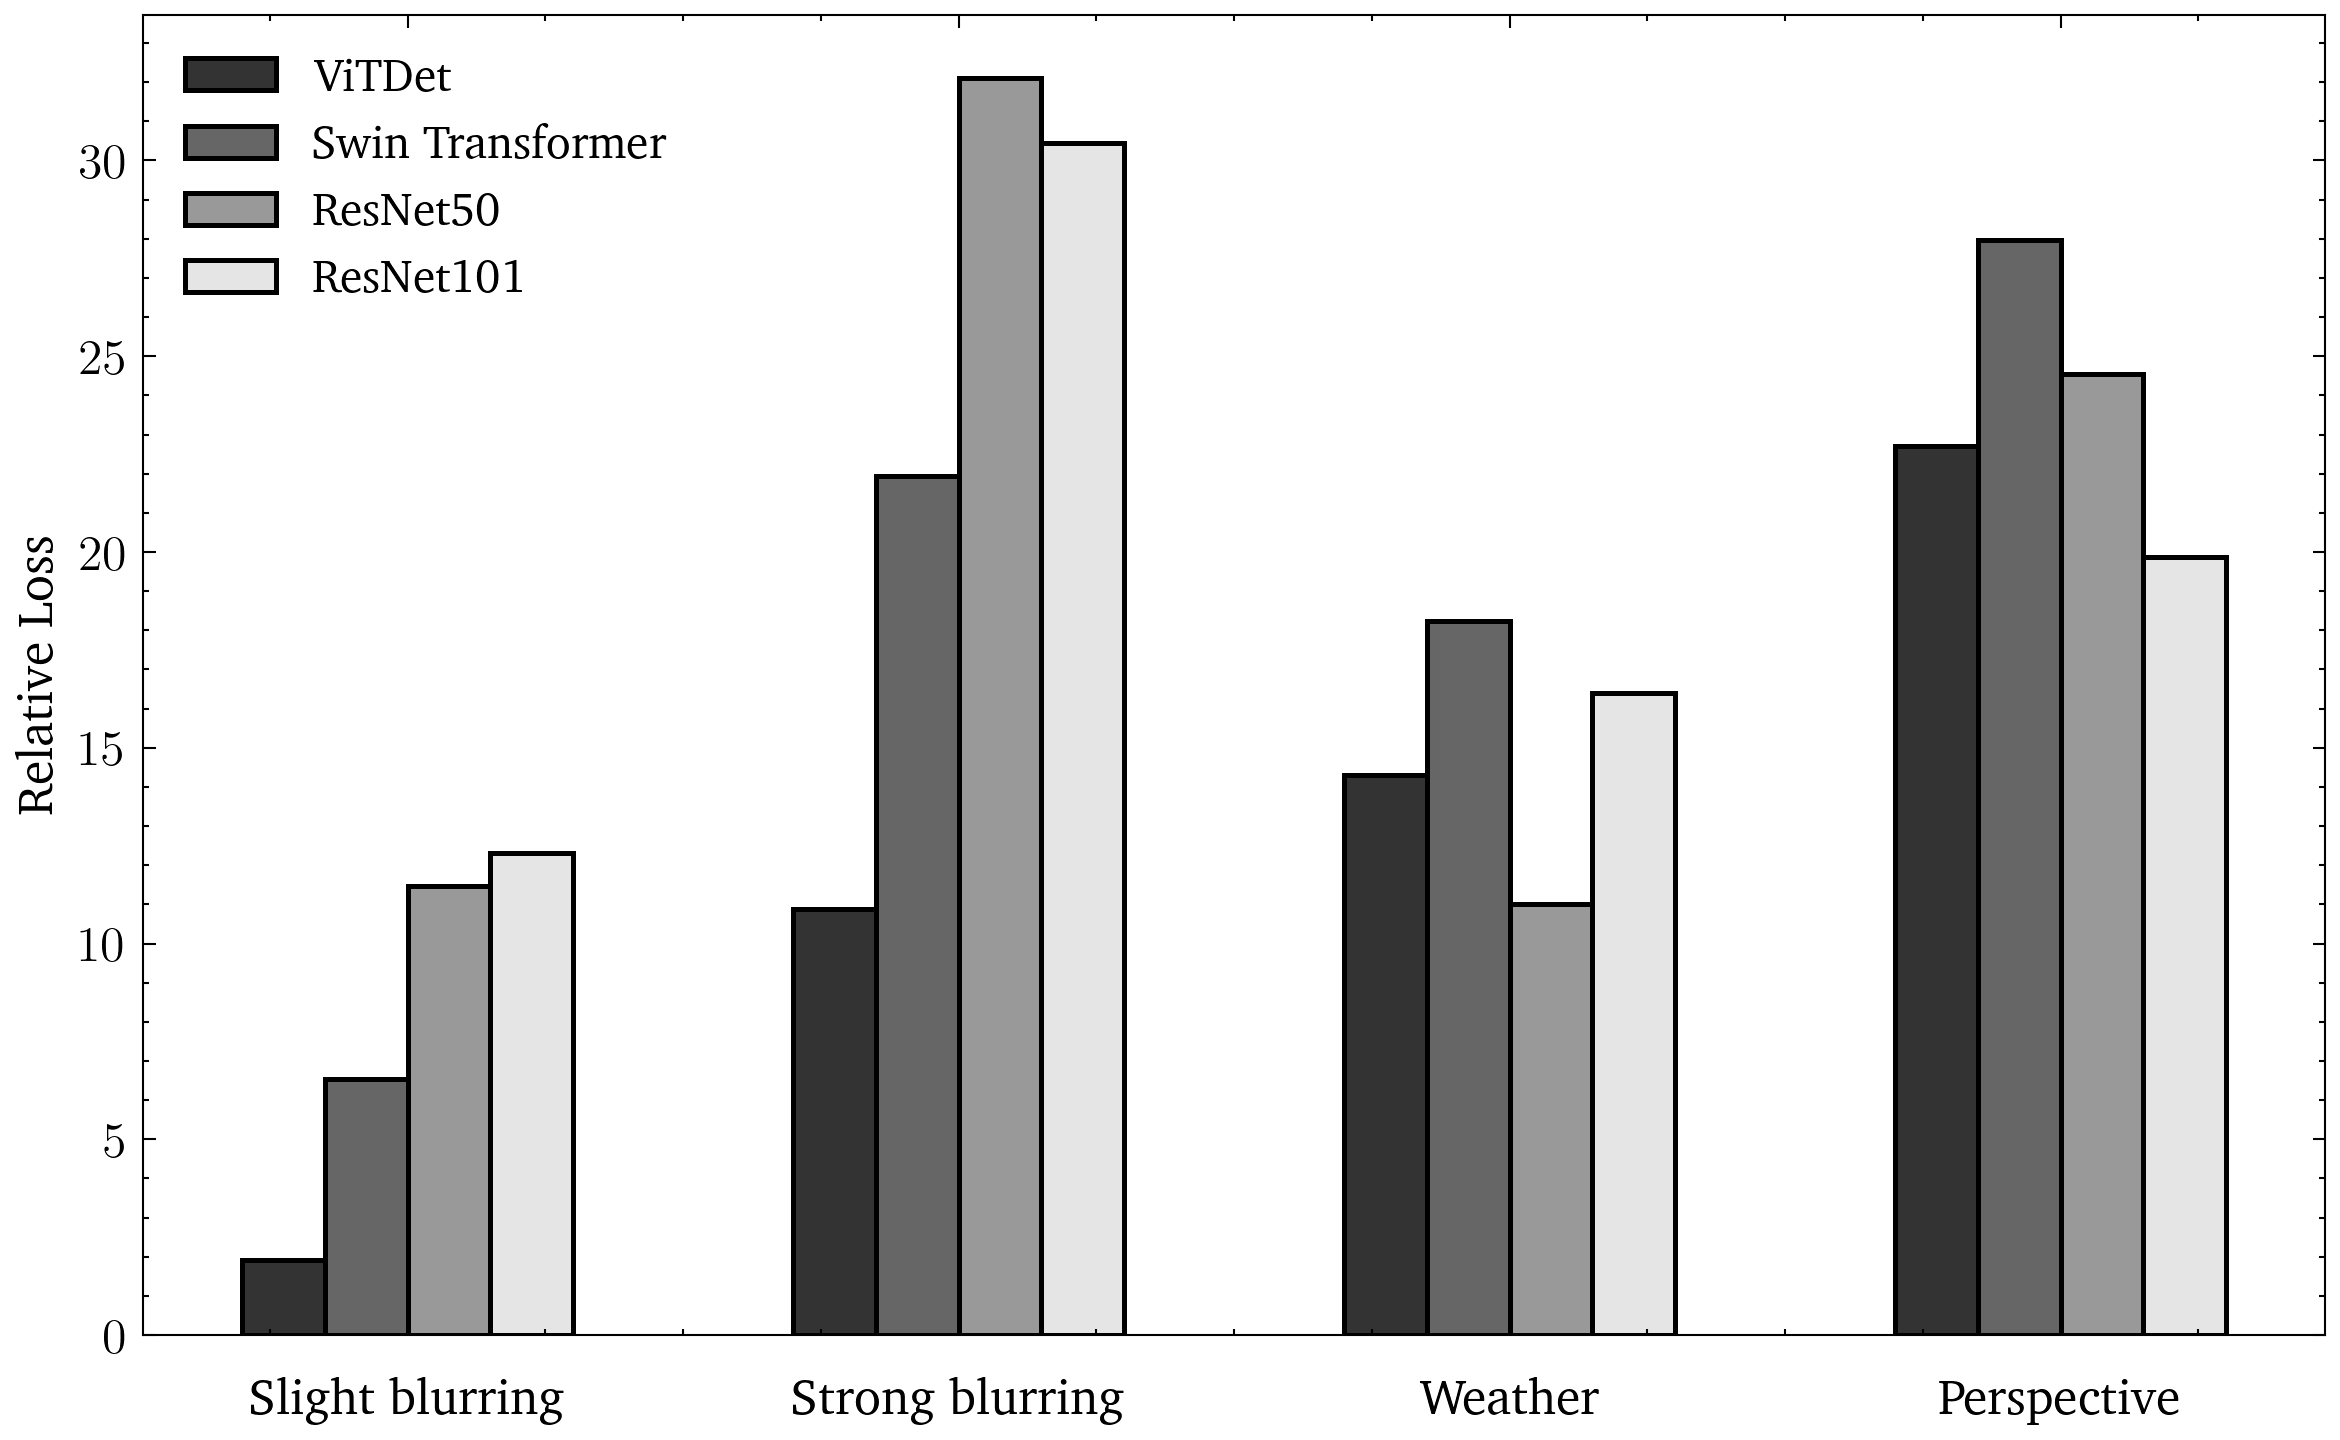
Relative performance loss under motion blur, weather changes, and perspective shifts, per architecture
Under light blur, everyone holds up fine. Under strong blur, everyone loses ground, but ViTDet loses noticeably less than the other three. Against weather changes and camera-angle shifts, the architectures mostly perform alike; nothing stands out there. It’s a synthetic test, not footage of an actual spinning blade, but it’s a strong enough hint that ViTDet specifically is worth pointing at operating turbines next.
A quick side experiment: does thermal help?
We also tried feeding Swin Transformer both RGB and thermal image pairs at once, fusing the two feature streams with a learnable weighting factor, the same fusion trick we used in earlier work spotting hotspots on solar panels with drone-mounted thermal cameras.
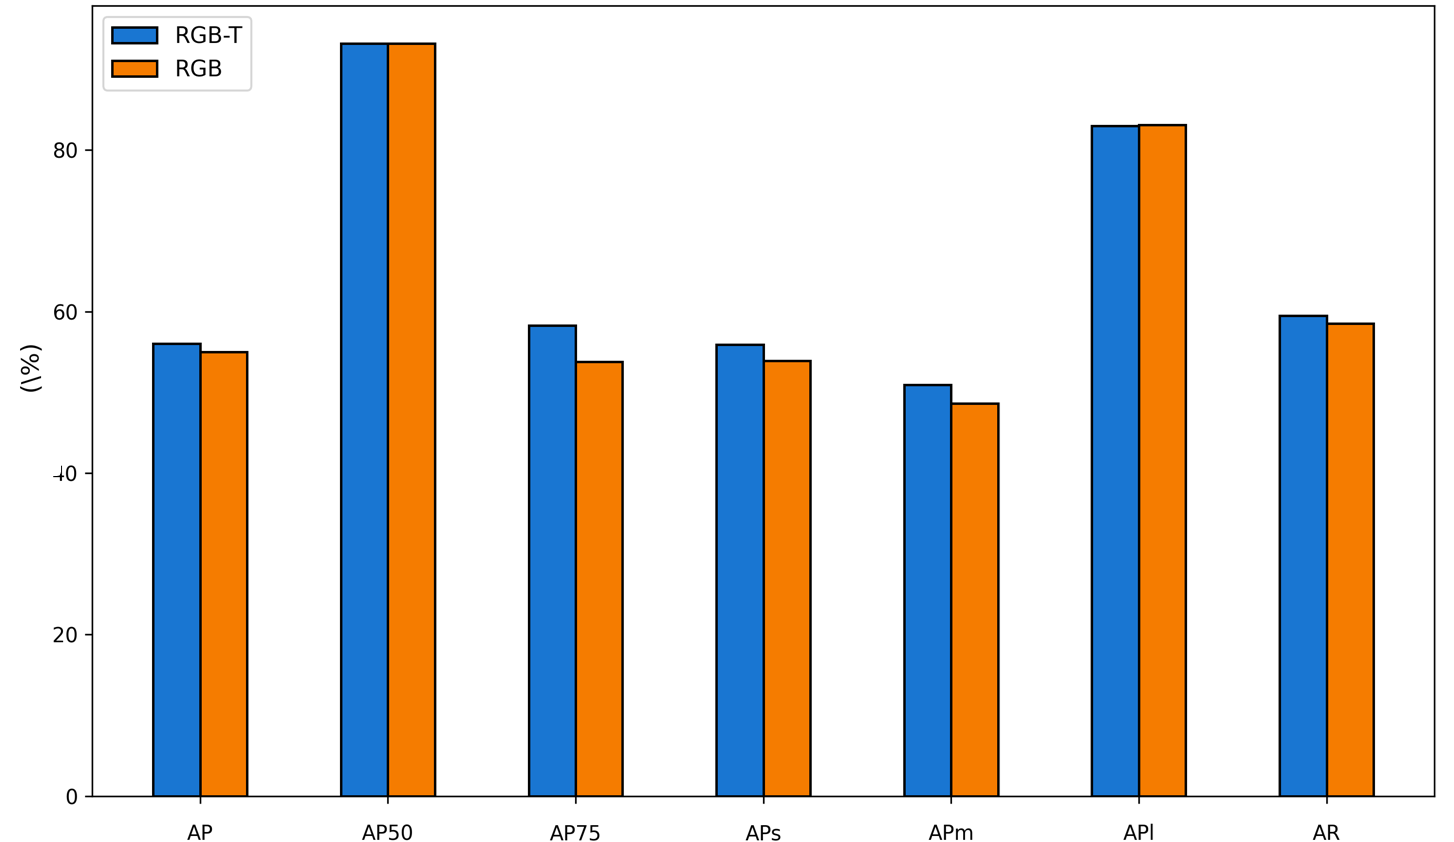
Bounding box metrics comparing RGB-thermal fusion against RGB alone
The gain was real but modest: AP moved from 55.0% to 56.0%, with a more useful 4.5-point jump at the stricter AP75 threshold. The limiting factor was sunlight, or the lack of it. Our images were shot without strong solar radiation, so the thermal contrast that would normally make damage glow against the surrounding blade barely showed up. What’s unambiguous is the cost: running two parallel feature streams instead of one nearly doubled the parameter count, from 107 million to 194 million.
What it costs to be right
Model | FPS (GPU) | FLOPs | Parameters |
|---|---|---|---|
ResNet50 | 49.3 | 62.5G | 43.9M |
ResNet101 | 41.5 | 82.0G | 62.9M |
ViTDet | 20.4 | 285.6G | 110.5M |
Swin Transformer | 30.5 | 141.2G | 107.3M |
Accuracy isn’t free. Swin Transformer delivers the best results at roughly half the compute of ViTDet. A good trade if you can put a real GPU in the pipeline. ViTDet costs the most to run but held up best under motion blur, which might matter more than raw accuracy once these systems point at turbines that are actually turning. ResNet101 is the fallback if compute is genuinely constrained and a coarser, less confident outline is an acceptable trade for speed.
A blade replacement costs vastly more than a GPU. For most operators, that math settles the question quickly.
The paper, co-authored with Moritz Hass at Jade University of Applied Sciences Wilhelmshaven, is available here and was presented at DACH+ Energy Informatics 2025.